
Many of our clients need to report the ROI of using assessments to their bosses.
To do this, you need good predictors as well as valid and reliable performance data.
However, if you are starting out, you won’t have any data yet. But you can still estimate ROI. That is what this article and Excel will help you to do.
Estimating ROI might feel like a daunting task, but it doesn't have to be. There are many ways to do this. In this blogpost I will share how we use the Brogden-Cronbach-Gleser (BCG) formula (Cascio, 2019) to quantify value or utility in monetary terms. Using utility to calculate ROI is easy and managers seem to 'get it'.
ROI = (BENEFIT - COST)/COST
All managers know and love ROI. It is simple to calculate and you can use it to compare different options and make economic decisions.
The hardest part of any ROI calculation is stating the 'Benefit' (and it can be many different things) into monetary terms. The same applies when determining the value of using assessments. Quantifying benefit is where BCG comes in. The result of BCG is utility or the Net benefit of a particular selection process stated in monetary terms.
To help you quantify this value, we have created this Excel spreadsheet.
The inputs you will need are the following:
Average annual salary for the job in question.
An estimation of the complexity of the job (see explanation below).
An estimation of the correlation coefficient between your predictors and performance.
The number of candidates in the selection process.
The number of candidates who will be selected.
The total cost per candidate in terms of the selection process.
The expected tenure of the selected employees in the role.
You should be able to obtain the above quite easily, but before you start playing around with the model, let us explain how everything fits together. It is important to understand the logic of using BCG with ROI, especially if you need to explain it to your boss!
The BCG formula for hiring utility:
Utility is the gain/loss from various courses of action and can be calculated with the following formula:
Utility = (Correlation × SD of job performance × Average Z of selected candidates × Average tenure) − Total cost of selection.
The logic here is that if you have valid and reliable predictors of work performance, and you know how much performance is worth and how it is spread, you will be able to select the best candidates who are worth the most to the company. The formula can quantify this value, which can then be used to calculate ROI. This calculation will help you to justify the cost and effort of selecting the best employees using assessments, as well as help you compare different selection approaches/methods to make optimal economic decisions.
Correlation: Does your selection process predict work performance?
This is the correlation between your predictors (which may be multiple) and your criterion (work performance).
To validate your predictors for your context you will need criterion data with which to run correlations.
Since we are assuming you don’t have any data yet, we will be estimating the correlation. Read the literature (see table below from Schmidt & Oh, 2016) to get an idea of how predictive certain instruments or psychological constructs are in general. At this stage you may input a variety of different correlation figures into the spreadsheet to see how they impact on utility.
When estimating, keep in mind that different predictors overlap quite significantly. To illustrate: if you are using a battery of cognitive, personality, and integrity assessments you can play around with correlations of .10 (low) to .70 (high) to see how they impact utility. Perfect correlations don’t exist.
Once you have predictor and criterion data you can run a regression model to determine the actual correlation coefficients for each predictor and for your process as a whole. Once you’ve got to this point you can refine the effectiveness and efficiency of your battery even further.
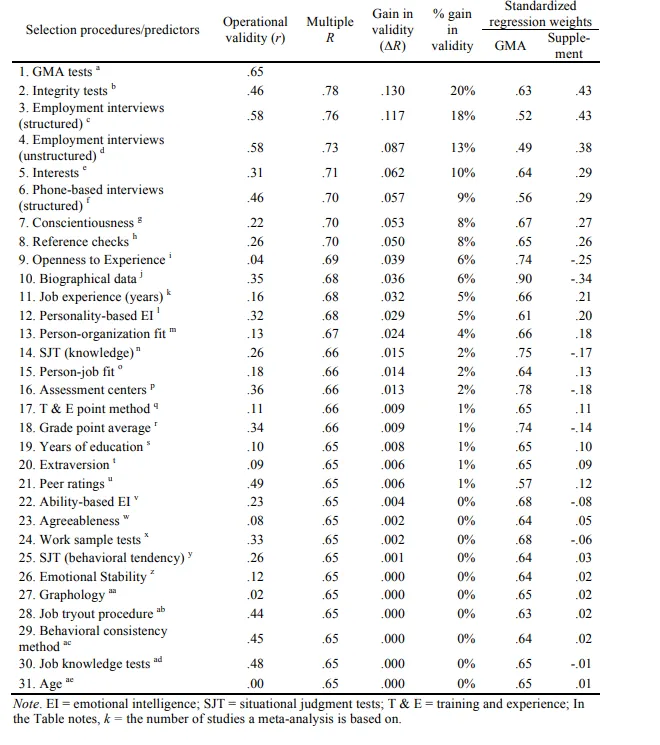
Table: How well certain selection methodologies correlate with work performance by themselves (Operational validity), as well as how much incremental validity they add over and above General Mental Ability.
The standard deviation (SD) of job performance: How much does performance differ from one person to the next?
Work performance is your dependent variable – the thing you are trying to predict. The key here is to understand that people differ, and thus different people will perform differently in the same job.
The variable we need for the BCG formula is the Standard Deviation (SD) of 'work performance' (however measured) in monetary terms. The reason for this is because we want to relate the benefits of the selection intervention with its costs to get utility.
Since we are starting from scratch, we will use the salary and complexity of the job as a proxy for the value and spread of performance. Researchers have found that the top performers in complex jobs typically produce about twice as much value as average performers (Hunter, 1983). When that variance is expressed in standard deviation units, it works out to roughly 40% of salary. This may apply to professionals or managers. For lower complexity jobs such as technicians and sales representatives that spread is typically lower, i.e. 24%.
In the spreadsheet you need to input your estimation of the complexity of the job in question, as well as the annual salary to get an estimation of the value of one Standard Deviation of work performance.
Average Z score of selected candidates: How well do those you hire score against those who apply?
The logic of ROI in selection is that the candidates who score the best (high Z scores) in your selection process (assuming it’s valid), will also be the best candidates in terms of performance.
Generally speaking, you will have a large number of candidates apply for a position. By submitting them to a valid selection process you will choose only the best candidates to fill a small number of available positions.
Since we don’t have any scores yet, we can use the selection ratio (the number of vacancies/the number of applications) as a proxy for the Z-score cut off in the spreadsheet.
In essence, the smaller the selection ratio, the better the selected candidates compared to the rest, and vice-versa.
Later on, as you start collecting data on your predictors and measuring actual performance, you can optimise the accuracy and economics of your selection process.
Tenure: How long do hired workers stay with your company?
Tenure is how long you expect the hired candidates to stay with the company. Since the cost of selecting them is a once-off - the longer the better.
Presenting your findings to management
Once you have input all your variables into the BCG utility formula (see the Excel spreadsheet we’ve shared), you will need to play around a bit to get a sense of your parameters for each variable given a particular job. This will give you a sense of your budget and the number of candidates you could viably put through the process, even how your process may need to change to optimise it.
Your next challenge will be to talk to your boss about what this all means.
The BCG utility formula itself will give you a utility number, sometimes a large one, which managers are often quite uncomfortable with. In our experience this number by itself doesn’t always make sense to managers. They don’t always get what it means.
An easy way to ‘land’ this is to relate it to something they know, namely, ROI.
BCG utility is the same as Net benefit in ROI. You’ve quantified benefit (performance in monetary terms multiplied by the probability of getting it).
So, if you divide the Utility (Net benefit) by the cost of the intervention, you will get the ROI of the intervention.
Other ideas for communicating value:
Total value of the employee:
Adding utility to the average salary is an estimate of the selected employee’s total value to the company. This helps managers ‘get’ the idea that they are paying a salary but getting more than the cost in terms of performance.
Employee cost as % of value:
Extending the idea above, you can also describe the employees’ total costs (Cost to Company - CTC) as a % of their total value. This may be a good benchmark number to determine pivotal roles in your organisation, e.g. “This cohort’s CTC is 80% of their total value, which is in line with our expectations for this position.”
Links
Feel free to play around with our ROI spreadsheet
References
Boudreau, J. W., Cascio, B. F., & Fink, A. A. (2019). Investing in people: Financial impact of human resource initiatives (3rd ed.). Society for Human Resource Management (SHRM).
Schmidt, F. L., & Hunter, J. E (1983). Individual differences in productivity: An empirical test of estimates derived from studies of selection procedure utility. Journal of Applied Psychology 68(3), 407-414. https://doi.org/10.1037/0021-9010.68.3.407
Share this post

Newsletter
Get up-to-date industry news right in your inbox